
A friend of mine once told me, “If you build it, they won’t come.” I thought he was jaded, or maybe he’d just seen the wrong movie, but recent experience has taught me he’s probably right.
The reason anyone builds anything is probably some combination of a) they enjoy it and b) they think they can do it better. I’m really no different. I built Dayzle because I like puzzles and I didn’t like how other puzzle games exploited their users. The more I dig into how user acquisition works, the more I understand why they have the model they do.
When I set out to build Dayzle, the premise was simple: build an app that’s fun to play and shows you the stats behind your play, so you can see if you’re improving. Something I would like - and I can’t be that unique in the world. So far the data sorta backs me up. The app has great retention metrics and terrible “everything else” metrics.
Put another way, I’ve built it and they haven’t come. So, like any good product manager should, let’s break the problem into its parts and start measuring. Measuring gives you a clear, unbiased picture of where you stand today. You can always lie to yourself and slice the data until you find the number that suits you, but if you measure honestly, you can see what’s working and what needs work.
The steps
Here’s how we think about app user acquisition:
- See our ad and tap it.
- Install the app.
- Play a game on the first day.
- Come back the next day.
- Keep coming back.
The first three get people in. The last two are where we get paid: someone who keeps coming back sees more ads, or buys a subscription so they don’t have to.
Counting strangers only
Being small makes measuring weird. A friend downloading is a rounding error for an app with a million downloads. For us, my friends are a real share of the player base, which is flattering and statistically useless.
So for steps 1 and 2 I used Apple’s own numbers for our search ads, leaving out anyone who searched for “dayzle” by name. The window is October 1 to 11, the last days before we changed the app’s look. For steps 3 to 5 the ads don’t have enough installs yet, so I used everyone who installed from outside Canada since August. We’re Canadian, and so are most of the people who heard about us from someone - friends, and friends of friends who just like puzzles. Leaving out Canada leaves out most of them, so this is as close as our data gets to true strangers. I also left out installs from Google’s Android ads, which were mostly a bot farm (that’s its own story).
1. Tap the ad: 1.5%
The median for games on the same kind of search is 6.3%. An Apple search ad is basically your icon, your name and your first few screenshots, so about 98 of every 100 people who saw what Dayzle looks like kept scrolling. It also compounds: Apple shows ads that get tapped more often, so a low tap rate gets you shown less.
2. Install: 28%
85 taps, 24 installs. The median for games is 60%. So most of the people who did tap looked at the store page and left.
To be fair to them, here’s what they saw. Our US page had 4 ratings, and one of the two reviews on it was three stars, titled “Feels like it was vibe coded”. It called the app “kind of ugly” and named a competitor’s app as better. The conspiracy theorist in me wonders whether it was planted. But real or planted, it’s what our potential players saw.
3. Play on day one: 52%
95 of the 183 who installed played a game that day. Nobody publishes this number, so I can’t tell you what normal is. What I can tell you is that about half the people who install Dayzle don’t play a single game on their first day, and that’s a huge hole in our funnel.
4. Back the next day: 20%
37 of 183. The average puzzle game gets 32%. So we start the second day with under two-thirds of the players a typical puzzle game has.
5. Keep coming back: 8.6% on day 30
The standard measure is whether someone opened the app on exactly day 30. 8 of 93 did: 8.6%. The average puzzle game is at 5.4%.
Eight people is a small sample, so here’s a bigger one: put Canada back in, friends and all, and it’s 27 of 258, or 10.5%. Friends flatter that number, but both point the same way.
So we start day two well behind and finish the month ahead. That means the people who come back stick at a much higher rate: for every 100 people who came back the next day, 44 were playing on day 30. For the average puzzle game it’s 17, and for games in general it’s 11.
Day 30 is a harsh measure, too. It counts a player who played days 1 to 29 and skipped day 30 as gone. Counting days instead:
- Of the 37 who came back the next day, 28 opened the app on 3 or more of their first 7 days: 76%.
- Of the 18 who came back the next day and have had a full month since, 7 opened it on 20 or more of their first 30 days: 39%. About 2 in 5 people who come back once end up playing most days.
The scorecard
| Step | Dayzle | Industry | Verdict |
|---|---|---|---|
| 1. Tap the ad | 1.5% | 6.3% (games) | Bad |
| 2. Install | 28% | 60% (games) | Bad |
| 3. Play on day one | 52% | not published | Half never play |
| 4. Back the next day | 20% | 32% (puzzle) | Bad |
| 5. Still playing on day 30 | 8.6% (10.5% with Canada) | 5.4% (puzzle) | Good |
| Day 30 per 100 back the next day | 44 | 17 (puzzle) | About 2.5x average |
So what’s the problem?
The good news is that after measuring, we know where we stand: we’ve built it, it’s good, and people can’t find it. And only about half of the ones who do find it actually play it.
We lose our players at the top of the funnel, not the bottom. Every step up to the second day is well below average. After that, we keep people far better than average: once someone comes back for a second day, they’re more than twice as likely as the average puzzle player to still be here a month later.
So we have two core problems to solve:
- Make the app more appealing in the store.
- Make the onboarding experience better.
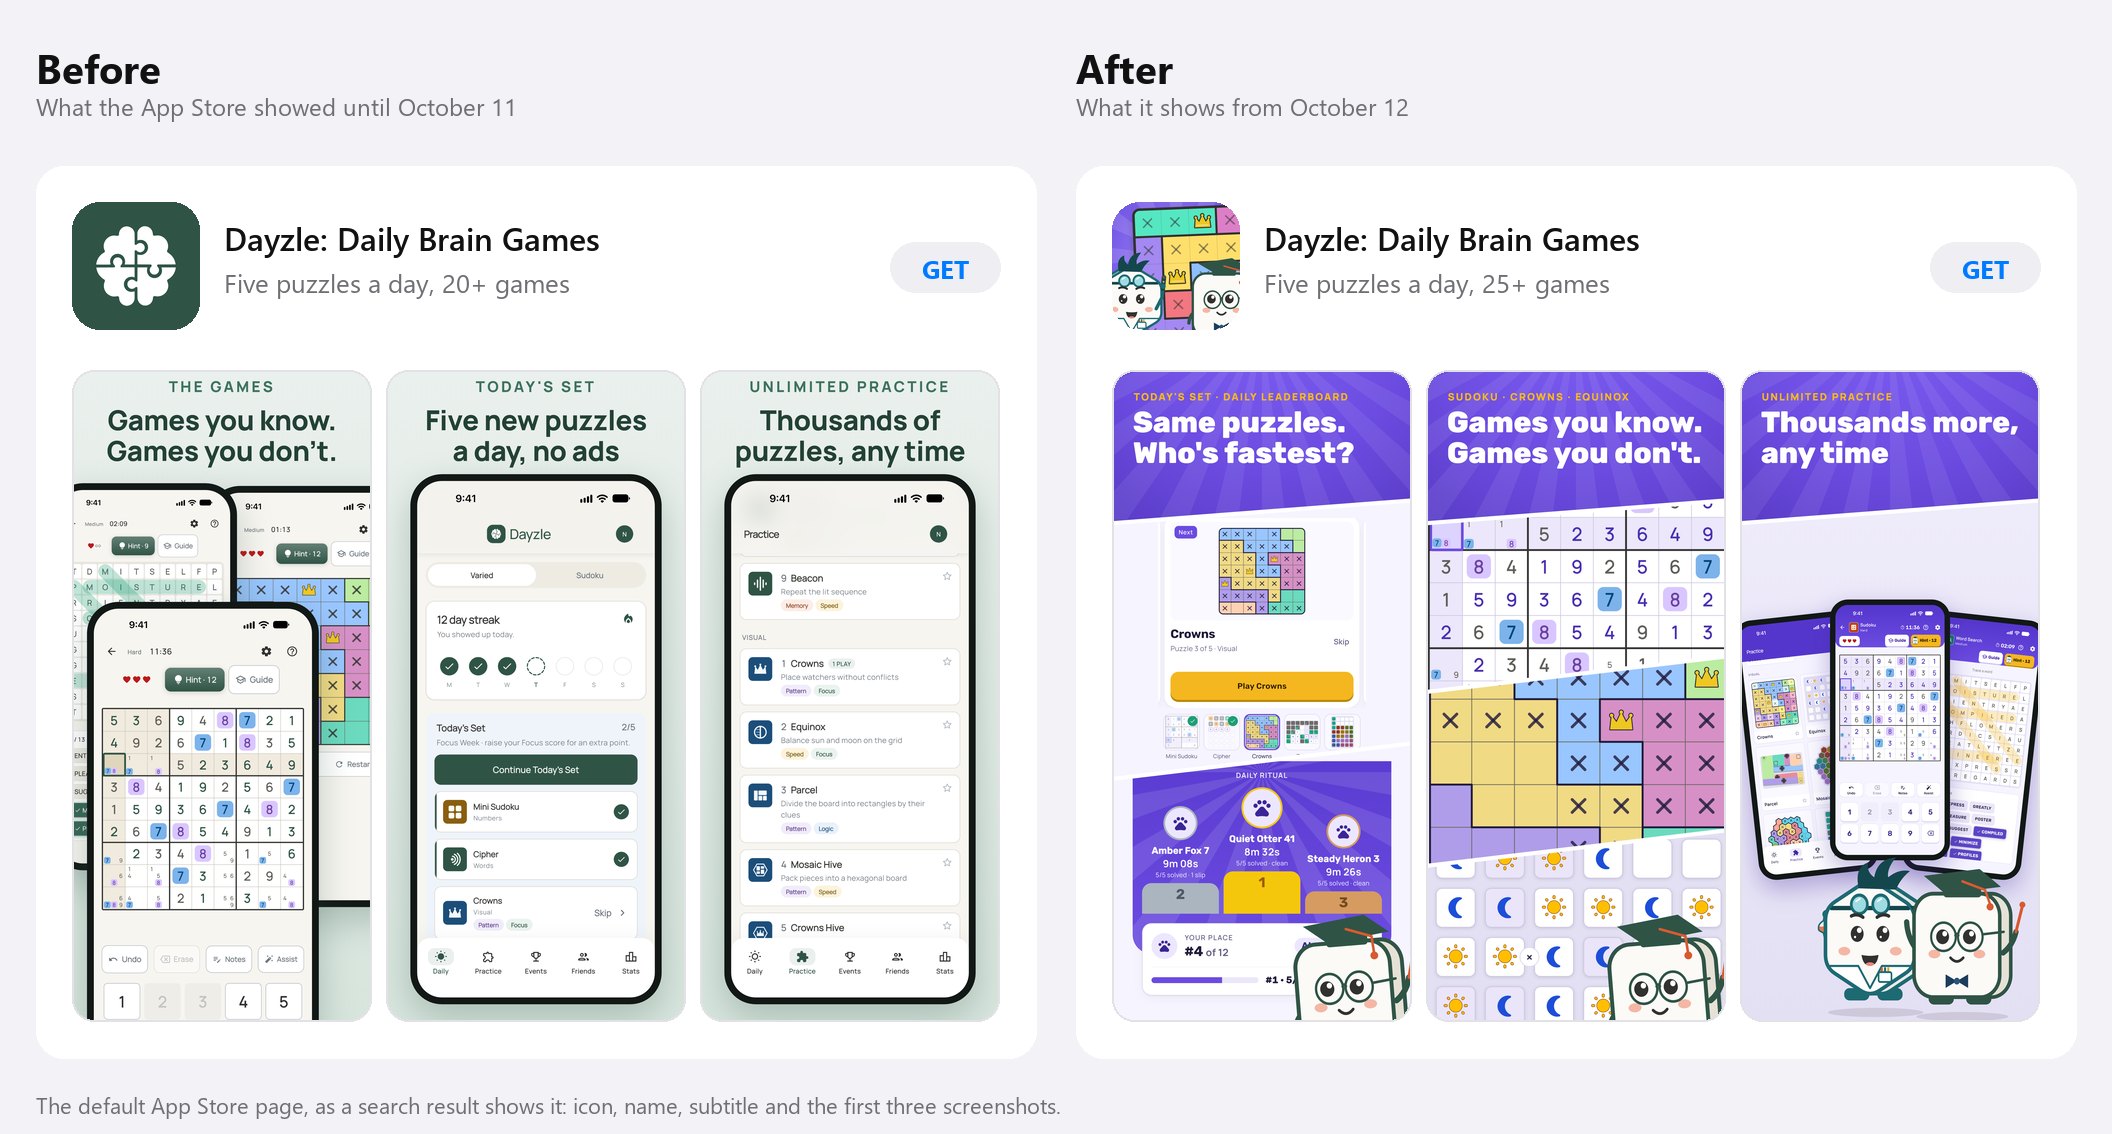
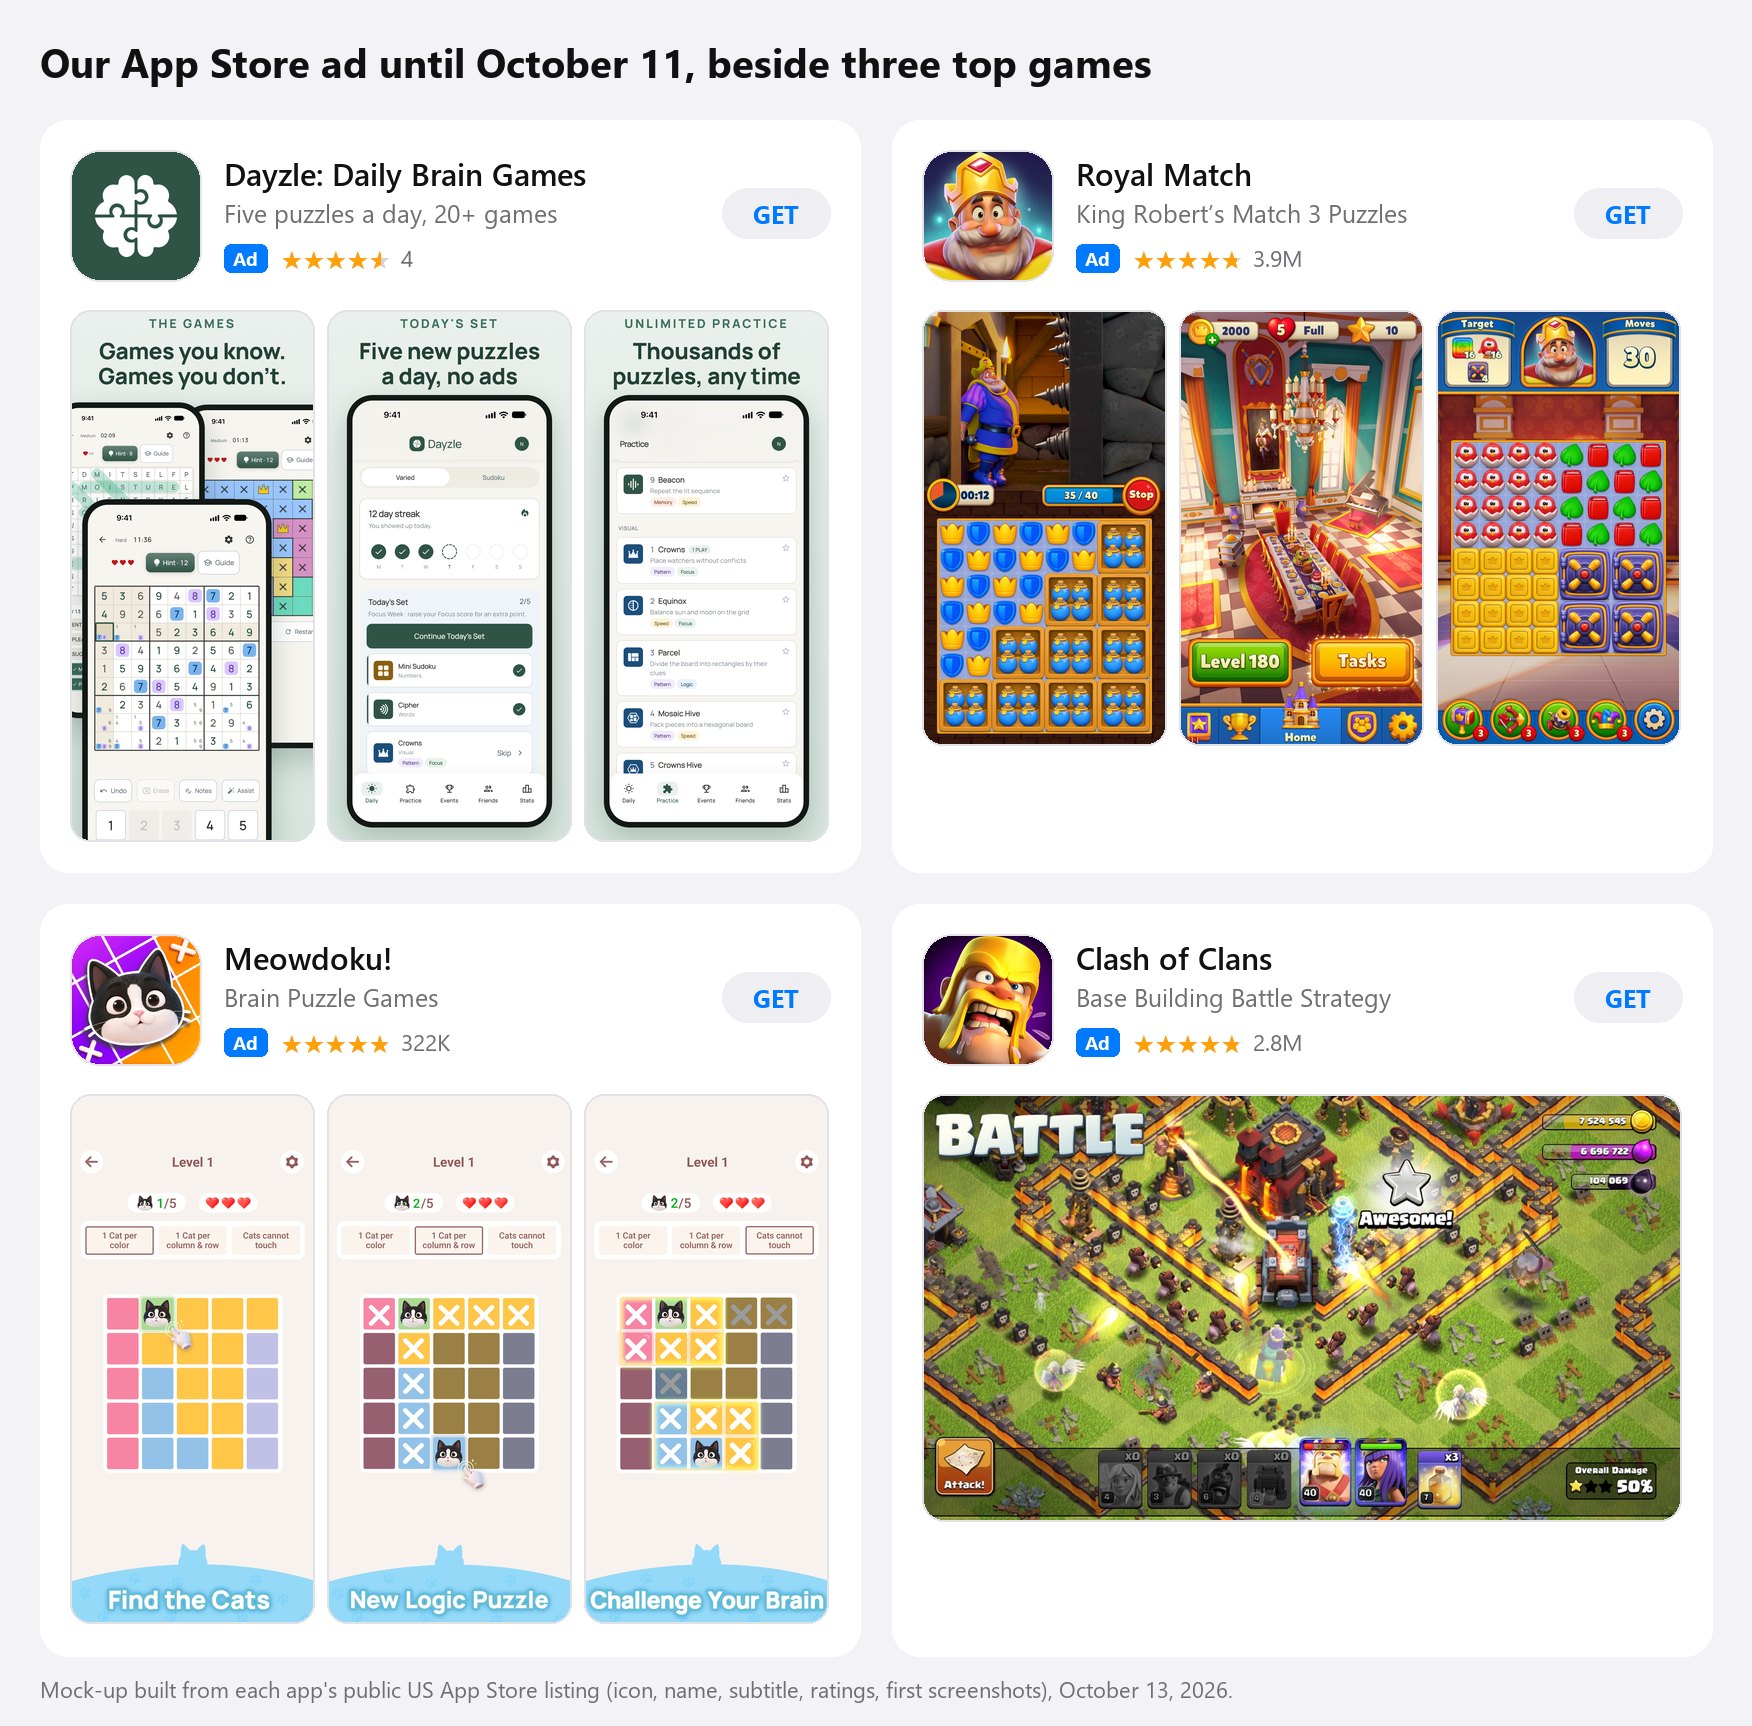
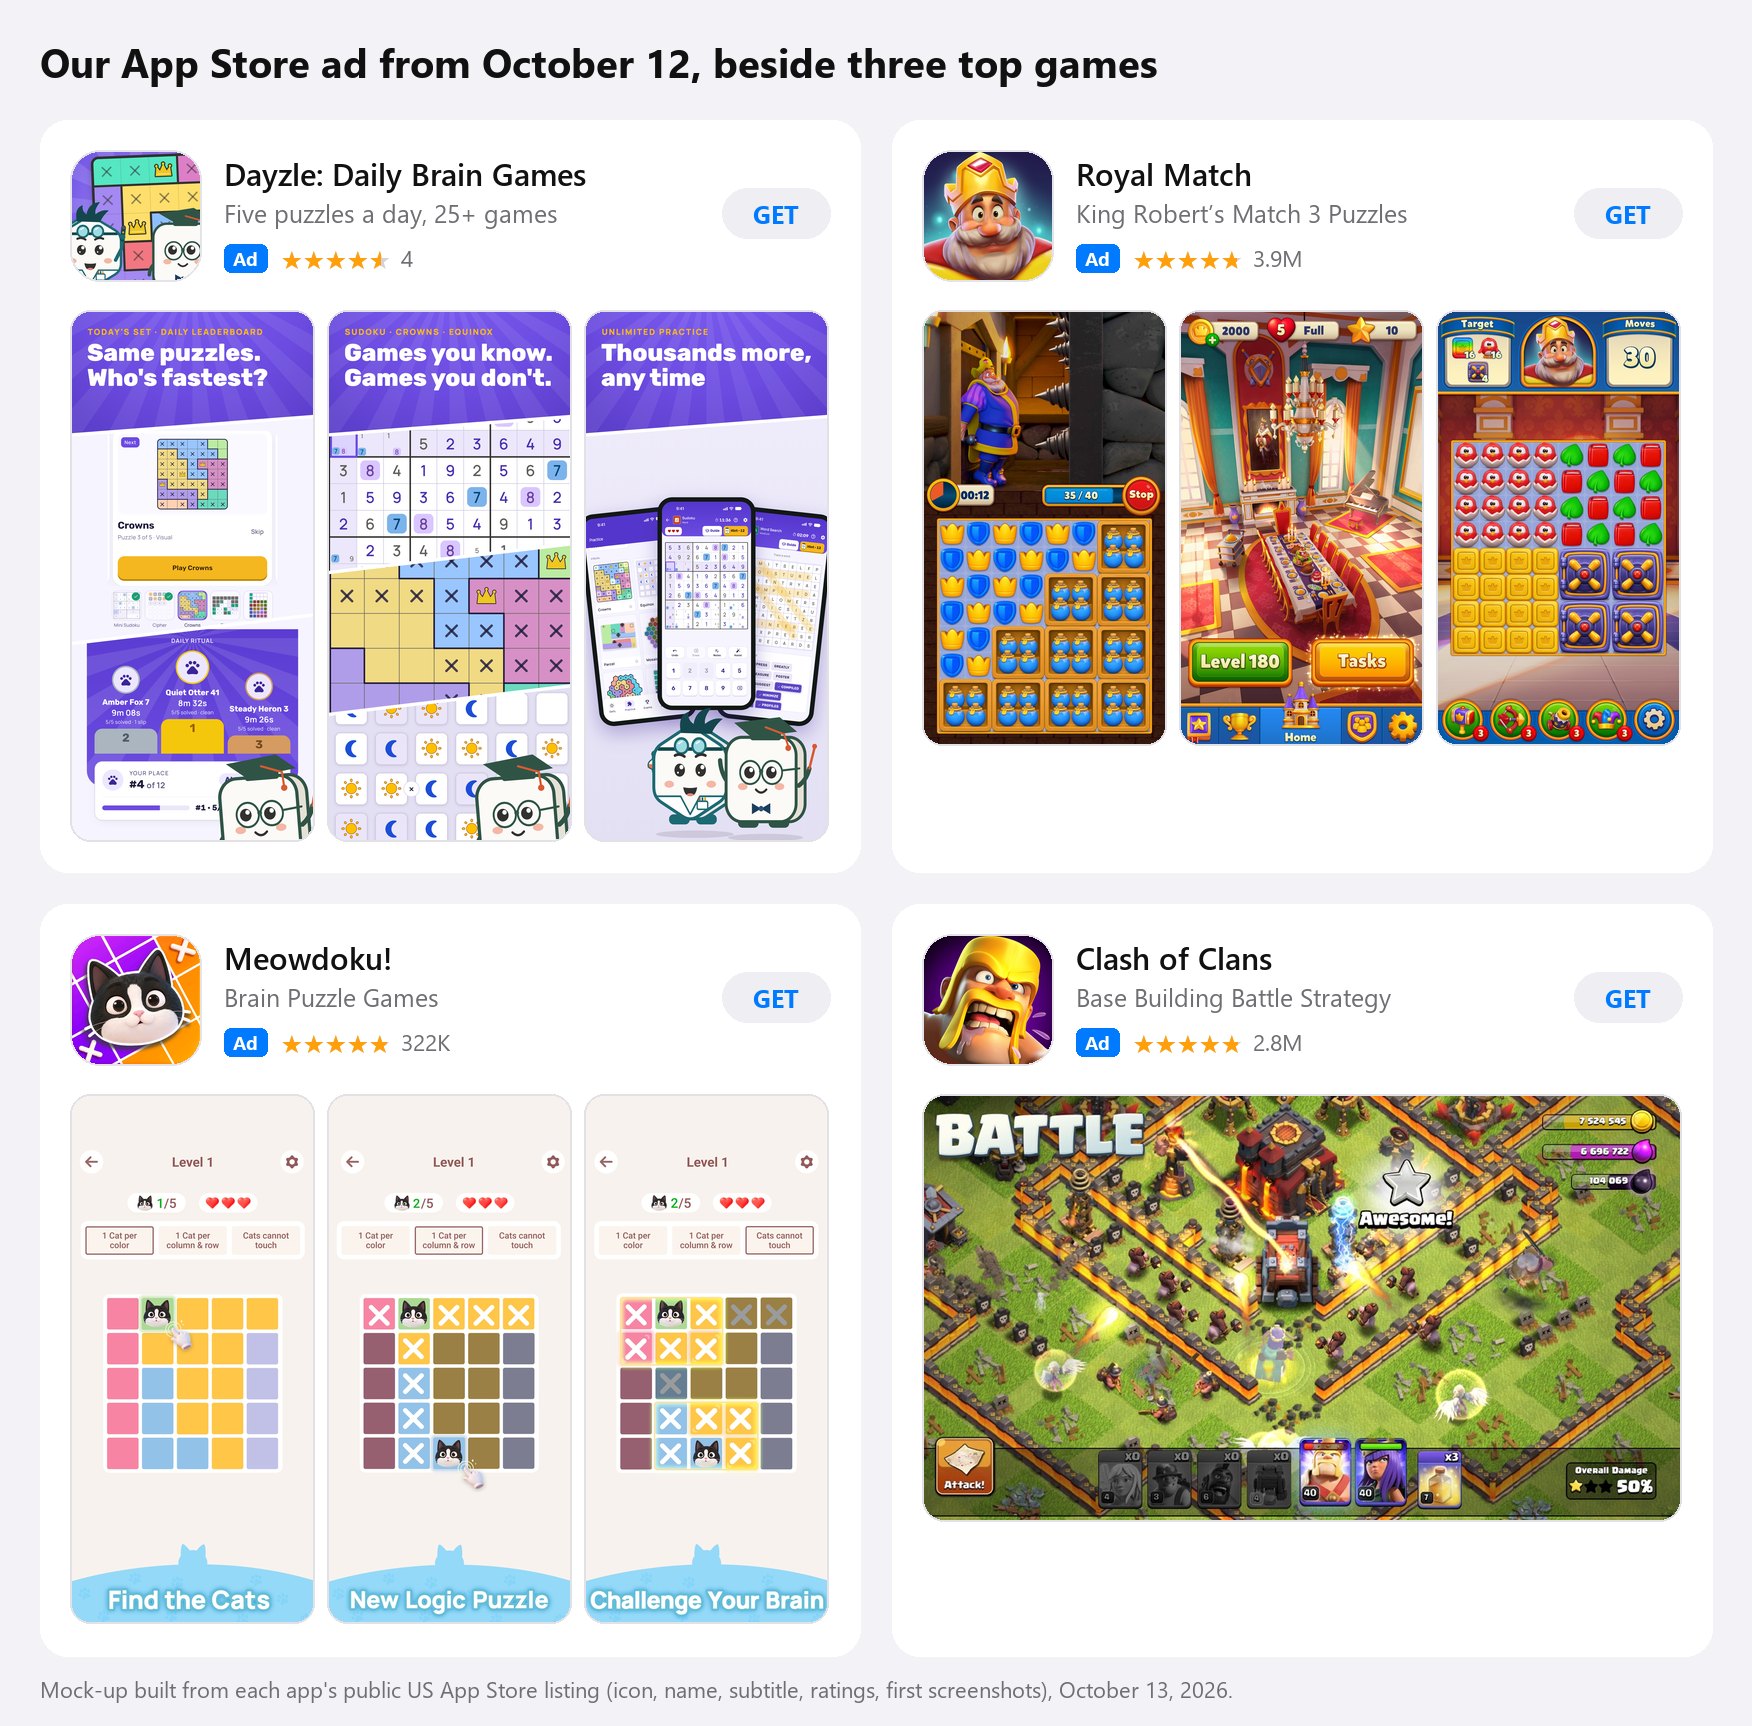
Our first focus is the store. Onboarding matters, but with more players it’s easier to see what’s working and what isn’t, so filling the top of the funnel is priority #1. It’s also where the problems were easier to see. Our original product thesis was that a calm look and feel was the path to our target players. The reality is somewhat different. Next to every other major game and puzzle app, our store page was flat and bland. People look at your icon for a split second before they scroll, and if you don’t have vibrant colours you can’t catch their eye (or at least that’s our new hypothesis).
It’s also where the math is biggest. If we hit the industry average on both steps, the same ads would bring in roughly 8x the installs: 4x on the taps, 2x on the installs.
So our first test was to completely reskin the app: new icon, new colours, new store screenshots. Here’s what someone searching the App Store saw before, and what they see now:
And here’s what we were up against. This is our ad beside three of the biggest puzzle and strategy games on the App Store, the way you’d see them if all four came up as ads in a row:
And the same four with our new look:
I’ll report back in a few days with the results of that experiment.